Category Archives: 01 Statistical Analysis

IB Biology StatBook 2026
Almost 15 years ago, on i-Biology, I released the first version of the IB Biology StatBook: an interactive Excel workbook to support teaching the (now defunct) Statistical Analysis unit and for data processing & presentation*. Now, with the help of Claude Design, I’ve updated and turned it into a live web-app.

The new microsite is on https://ifyouuseme.ai/i-biology/statbook under “Stats & Data” and includes:
The new microsite is on https://ifyouuseme.ai/i-biology under “Stats & Data” and includes:
- Decision-trees for choosing statistical tools.
- Interactive examples of everything IB Biologists need to do.
- Worked explanations of the various methods, including t-tests (paired and unpaired), Chi-squared tests, Mann-Whitney U tests.
- Guidance on data processing and presentation.
- Statistics glossary.
- Comparing means with bars, X-markers, error bars and population distributions.
- R² best-fit and dot-to-dot plotting.
- Curve detection and explanation of different types of curves.
- Outlier detection.
- Fixing appropriate decimal places.


Students could put their own data into this tool to see how the different approaches might work, but it won’t give them the final product. They will still need to understand and present their work appropriately. Teachers can use this to demonstrate the different forms of tests and analysis live in class.
If you use these resources, you are not using any AI: it is all handled locally in your browser.

These resources are hosted on the support site for (If You) USEME-AI: Learning for Hope & Agency in an AI World.
*it’s still live, you can get it (and the slides) here.
Crash Course: Statistics
Crash Course are at it again, this time with a new statistics course. This introduction might be interesting as you think about your IA’s. How do we understand what are data are telling us… and how do we design tests that will give us data that we can actually use?
Are you replacing sleep with food? DBQ practice.
https://twitter.com/scicurious/status/327240402367307776
I came across this through Ed Yong’s weekly linklist, but @SciCurious often writes really interesting posts (Neurotic Physiology) on neurobiology. This one is particularly relevant to #IBBio students for a few reasons. First, you guys are up way too late, way too often. Second, it connects directly to our course – read this blog post (based on this paper), especially students working on option A: Nutrition, or anyone reviewing hormonal control.
Click for the graphs & article at the Neurotic Physiology blog.
Finally it is ripe for data-based question practice.
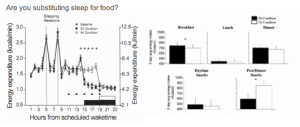
These graphs click-through to the originals posted at SciCurious’s blog. Here are some DBQ-style questions you might ask:
- Calculate the difference in post-dinner snack energy intake between having a ‘normal’ 9h sleep and the sleep-deprived 5h condition.
- Compare the trend in energy expenditure throughout the day between 9h sleep and 5h sleep.
- Describe the difference between 9h sleep and 5h in terms of eating patterns.
- Evaluate the hypothesis that “when we sleep less, we eat more” based on the data provided and information in the article.
- Explain the role of the appetite control centre of the brain on appetite, and suggest how it is affected by the conditions of the experiment.
Appetite Control: from the Wellcome Trust (‘The Anatomy of Appetite’ explainer page here).
……….o0O0o……….
So there you go – you learned something.
Get to bed. And leave the snacks in the fridge.
Bad Pharma by Ben Goldacre: quick review & course connections

The Book
There’s a good chance that you’d not be here to read this without the pharmaceutical industry designing and manufacturing the vaccines and medications you’ve used during your life – but how much do we know about where they come from?
In this thoughtful, well-researched and instructive book, Ben Goldacre* (doctor, evidence-based medicine proponent and author of Bad Science) outlines how Big Pharma works, but also what the issues are and how they can be fixed. He has a TEDMED Talk on the premise of the book (below) and takes care no to write a ‘hatchet-job’ on the industry, but to shine a light on the current state of clinical research and marketing.
I recommend the book to IB Biology and IB Chemistry students and teachers – read a copy before the next teaching cycle begins – as there are many sections of direct relevance to our courses that could be used as lesson ideas or real-world contexts for what we’re learning. It would make a great addition to the reading list for students, especially those intending to pursue medical, biochemistry or pharmaceutical careers.
In each chapter, Goldacre identifies a problem and gives a clear account of why it is a problem, using systematic reviews of academic literature and specific case studies to highlight each point. He makes it clear to the reader why these problems actually are problems, but also offers concrete advice or proposals on how to solve them.
Some highlights for the IB Biology course

Click & Go
Chapter 1 gets stuck in with statistical analysis and why systematic reviews of literature, meta-analyses and careful work with data are so important. It introduces the work of the Cochrane Collaboration and works through a neat illustration of the importance of considering all the data as more studies are carried out. The Cochrane Collaboration’s logo is itself a fascinating story, and you could model this in class with a simple set of investigations in the early stages of the course (see some ideas on the Statistical Analysis page).This video is very useful – from the Testing Treatments page.
The ideas and issues come thick and fast for the rest of the book.
As you read it, you will see many potential connections to the course, as well as to Theory of Knowledge. Here are just a few ideas that might spark discussion in class:
- What is the problem with missing trial data and publishing only favourable results?
- What does this publication bias do the reliability of the information we use to make decisions?
- How are drugs designed and tested (this is super interesting, going from in-vitro and animal testing to stage 1, 2 and 3 human trials, and has an obvious link to the IB Animal Experimentation Policy).
- What are the ethical issues with human testing, in particular the ideal/ representative nature of the patients used and the incentives they receive?
- What is the impact of outsourcing trials to other countries that might have different ethical codes?
- What are the ethical issues of randomising and controlling trials with humans, particularly in cases where there is a known drug that helps compared to a new drug?
- What are the roles of drugs regulators on medicine and are they working?
- How should trials be designed to give more valid and reliable data (for example, comparing the ‘new’ drug against the current best alternative vs placebo)?
- How could we use nationwide health records to conduct larger, simpler trials to determine which treatments really are most effective?
- How do the many branches of pharmaceutical marketing affect decision-making and how can we recognise and mitigate for this?
- How can we fix it all to keep medical innovation going whilst generating reliable, cost-effective data and drugs?
TED Talk: What doctors don’t know about the drugs they prescribe
*Yeah, I know I’m a bit of a fanboy and have featured him on here a lot, but with this and Bad Science, he has produced a lot of useful content to connect to our classes.
Hans Rosling’s Joy of Stats
![]()
Now available in full, this one-hour documentary is on Hans Rosling’s GapMinder website.
A brilliant, visual and entertaining view of 1.1 Statistical Analysis, using real datasets and graphics to highlight statistics, means, distributions, graphical representation, correlation and cause. It is most relevant to us from the start up to 37:30.
Here is a neat clip from the show when it aired on the BBC.
Excel Graphing Screencasts
These two videos are for my classes, made using the free screencast tool ScreenCast-O-Matic.
The first is for my IB Bio group for setting up a graph for a complex set of data, adding extra datasets, error bars and formatting. The second is a similar video for a simple Physics investigation in Grade 10.
Hopefully they are helpful as you can go back and re-watch important bits as you do the write-ups.
If anyone knows of a decent way to add best-fit curves (lines are easy) to datasets, please let me know!
Statistical Analysis 2009
Here is the updated presentation for 2009, with more information on Excel and a worked set of examples with hummingbirds, to tie in with the natural selection topics.
And Geoff Browne kindly gave permission to upload his t-test powerpoint to slideshare:
Resources:
Updated Essential Biology 01 – Statistical Analysis (word)
Click4Biology statistical analysis page, with great help for calculators and excel
Excellent Handbook of Biological Statistics from John MacDonald
Sumanas statistics animations
Field Studies Council stats page, including the t-test
Open Door Website stats page and help with graphs and tables
Gapminder awesome human population stats tool
And this enlightening talk from Han Rosling: No More Boring Data!
–
Using your calculator:
– Using the TI GDC (from Click4Biology)
– Using the Casio pdf download (from keymath.com)
TED – 50 million views young (and the best graphs EVER)
TED (Technology, Education, Design) has racked up 50 million views since 2006 and is proof that people can use the internet for more than just celebrity gossip and the dodgy sites. They now have a highlight reel of their top ten talks, including the $40 SMART Board, some oceany greatness and lessons learned while having a stroke. Ken Robinson’s talk is up there (are schools killing creativity?), and one of the coolest bits of statistics you’ll ever see from Hans Rosling:
After watching that, you should absolutely must head straight on over to gapminder.org and be dazzled.
You can even access the gapminder graph and manipulate both axes. Awesome.
Graphjam and Graphical Silliness
Here’s a response to silly graphs on TV news shows (is it Brasseye?)
The Graphjam blog has loads of funny (and not so funny) pop-culture referencing graphs…
… as does the Facebook group “You’re having a graph”
Idea: have a stupid graph-making challenge – middle school link with Maths?
Here is Brasseye with Heavy Electricity:


