Data Literacy with ‘Explore’ in GoogleSheets
Super-quick lesson idea for teaching datasets and presentation types. When processing data in Google Sheets, use the ‘Explore’ feature, highlighting parts of the dataset. Click here for an example (to save a copy, go to ‘file –> make a copy’).
For: Sciences, Maths
Thanks to Liz Durkin (@lizdk) for the reminder of this feature.
Questions to ask students
- What are different types of data (continuous, discontinuous)
- Why do we use graphical presentations of data?
- What information do we need to be able to present data clearly?
- Why are some data presentations suitable for some sets of data and not others?
- How are the ‘basic’ presentations of data limited? (or Why can’t I use a bar chart for everything?).
- How does my interpretation of the data change when I change the graph or chart type?
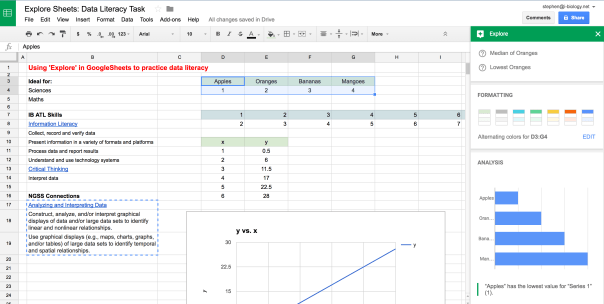 Explore in GoogleSheets – a quick way to visualize some of the data collected in an experiment or survey, and an opportunity to teach some data literacy and critical thinking skills. Click to open.
Going Further: Here is a set of resources for more advanced data presentation and statistics, used for IBBio, but useful for more: IBBio Statbook by Stephen Taylor. This one is for MYP Chemistry.
………o0O0o……….
MYP ATL Skills
| Information Literacy |
| Collect, record and verify data |
| Present information in a variety of formats and platforms |
| Process data and report results |
| Understand and use technology systems |
| Critical Thinking |
| Interpret data |
NGSS Connections
| Analyzing and Interpreting Data |
| Construct, analyze, and/or interpret graphical displays of data and/or large data sets to identify linear and nonlinear relationships. |
| Use graphical displays (e.g., maps, charts, graphs, and/or tables) of large data sets to identify temporal and spatial relationships. |
GoogleEarth Engine Timelapse: Quick Lesson Plan
Here’s a quick lesson plan idea for tuning into inquiry using Google Earth Engine Timelapse*. It can provide a timelapse of change from 1984-present, based on satellite and aerial photos.
Context
Ideal for: Individuals & Societies, Sciences, Interdisciplinary Unit
Global Context(s): Fairness & Development or Globalization & Sustainability
Key Concept(s): Change, Development, Interactions, Time-Place-Space
Related Concepts (I&S): Globalization, growth, resources, sustainability, causality
Related Concepts (Sciences): Environment, transformation, consequence, evidence
Tuning In
Find where we live and model See-Think-Wonder (Project Zero) on the timelapse from 1984-now. You might want to create a GoogleSheet with columns for each stage, to be shared with the class. Alternatively, get out some big whiteboards or butcher paper.
- See: look for general outlines, specific landmarks, big developments, interesting changes. Then dig deeper – compare the start to the end, or look for evidence of significant events in the time period. Keep pushing the ‘see’ until ideas are truly exhausted.
- Think: connected to the ‘see’ statements, note potential cause-effect relationships, sequences, consequences or other ideas. Keep going until this is exhausted.
- Wonder: finally build on the ‘see’ and ‘think’. What questions does this generate? Categorize and rank the questions.
Finding Out
- What lines of inquiry will you take to find out more?
- What can be found out by students and what needs to be explicitly taught?
- What unit-related vocabulary needs to be used and taught?
Approaches to Learning
- Access information to be informed and inform others
- Make connections between various sources of information
- Understand and use technology systems
- Practise observing carefully in order to recognize problems
- Interpret data
- Draw reasonable conclusions and generalizations
- Revise understanding based on new information and evidence
- Formulate factual, topical, conceptual and debatable questions
- Use models and simulations to explore complex systems and issues
- Identify trends and forecast possibilities
……….o0O0o……….
*HT Twitter:
8 Mind-Blowing Optical Illusions
Here’s nine neat minutes from Sci Show on illusions – classic and modern – that will be of use to those studying Option A: Neurobiology & Behaviour.
Before the Flood: The Science is Clear, the Future is Not.
New from Leonardo DiCaprio and National Geographic, Before the Flood is a compelling and powerful climate change documentary. Where are we in the world right now with our understanding, challenges and potential solutions. What actions need to be taken right away?
The full movie is was available initially for free on YouTube, and their action website hosts more resources for use in class or discussions. Click here for other platforms where you can view, rent or buy the movie.
Sam Harris: Science Can Answer Moral Questions
Timely and provocative, here is Sam Harris on facts, values, morals and perceptions. Jump here for lesson ideas. Trigger alert (it’s Sam Harris): some raw issues discussed.
A Great Batch of TOK Questions
This year’s TOK Questions are a great crop (I think) for connecting the sciences as an area of knowledge with many current and historical knowledge issues. Here’s a wee poster I made on PiktoChart for the questions. Which do you lean towards and why?
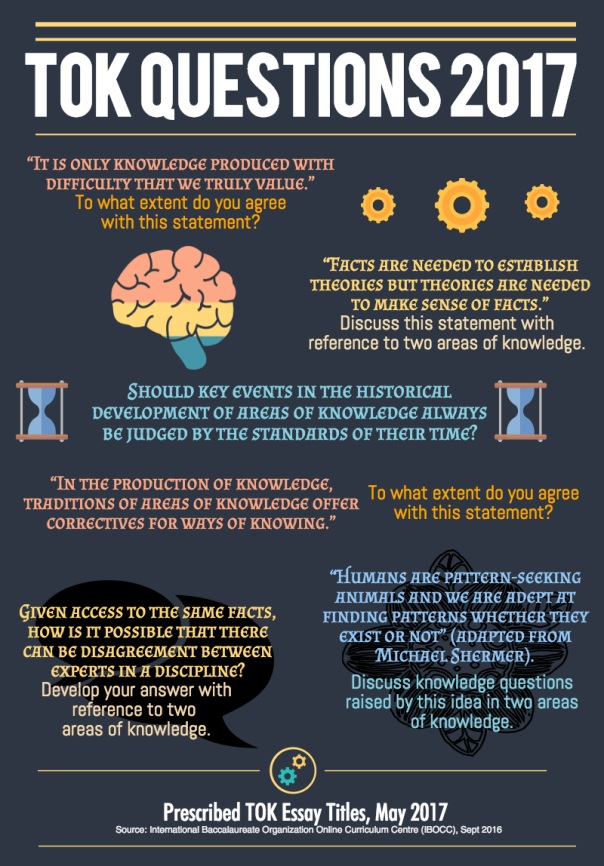
TOK Questions 2017. Source: IB Online Curriculum Center (login needed). Printable pdf here.
PaperPile: Managing Citations in GoogleDocs
I have been looking for something that can replace MS Word’s citation manager and work in a similar way to Zotero. Here’s a quick post on how to use the PaperPile add-on for managing references in GoogleDocs. Paperpile is free from the Chrome store, though I am using the upgraded version.

The Environment is Interdisciplinary
Working with Eco Club and thinking about the complexities of the interactions, causes, effects and issues we need to tackle, I am often reminded of this Lovelock quote, from a 2014 interview in the Guardian. Perhaps if we can get interdisciplinary teaching and learning right in our schools, we can help students make the connections they need to truly understand the deeper causes of the problems they might need to solve.
For a more detailed post on how we’re trying to tackle IDU’s, please see my blog.

James Lovelock on the challenge of really teaching people about the environment, from this Guardian interview: http://gu.com/p/3zx4j
Exploring Environmental Science: Student BlogPosts
In our current Grade 10 Environmental Science course, students have designed their own unit based on an area of interest and their subject choices for next year. This year’s class have broken into four groups: climate vs biodiversity, climate vs ocean and air currents, pollution & biomagnification, and invasive species vs biodiversity.
As part of the requirements for the unit, students must write a case study blog post, assessed using Criterion D: Reflecting on the Impact of Science, that explores an action taken related to their topic of choice. They were asked to look for some reliable sources, making the most of the blog format with suitable media and images. Successful blog posts teach the reader about the big ideas of their unit, through the lens of a specific case.
Here are some of their products:
- Kaiki’s Mercury in Fish
- Fred’s Artificial Photosynthesis, Turning over a new leaf for solutions to Climate Change
- Kikoy’s The Great Wall of Rivers
- Kayla’s Golden Mussels Should Be Feared As A Monster!
- Takeharu’s Oh no! The Bluegill Army is Attacking!
- Michelle’s The Bald Eagle throws DDT — an outrageous move.
- Doo Hyun asks how we can stop global warming?
- Natsuki’s “Bi Bi Fossil Fuel, Hello BioFuel”
- Juhaku’s Burmese Pythons costing citizens every year
- Mami’s MicroBeads
- Irma’s Plant a Tree; It’s Easy as One Two T(h)ree
Making the Invisible Visible: Climate Change & CO2
This is very neat video from NASA, showing carbon dioxide changes over time, with annotations. See a breakdown here.


