Category Archives: MYP
Pomodoro Organizer: Get Stuff Done
The Pomodoro Technique is an effective way to overcome procrastination, get started on big tasks (by breaking them into smaller tasks) and to use time effectively. Essentially, by “hacking” your brain’s reward pathway with manageable chunks of time and small reward breaks, it can help overcome the fear of getting going.
 This graphic organizer (pdf) is to help set a plan for a working period, recognizing that:
- Setting clear and realistic goal is essential
- Breaking large tasks into smaller steps helps get things done
- Rewards/short breaks keep the brain motivated
- Setting an overall end time is also really important
- A distraction-free environment will really help
Of course if, once you get going, you find “flow” and can’t stop working… then get it done!
For more ATL-related graphic organisers, click here.
Tech Tools:
- The Chrome extension Pomodoro Timer Pro allows you to set times and “blacklist” sites that might be distractions.
- Online Stopwatch has a good full-screen tomato timer. Scan the QR code below to start the timer running.
Reflecting on the Impacts of Science: IMaGE, Global Goals & Connections in MYP Sciences.
I’ve added a new page to i-Biology.net to post resources and ideas for MYP Science Crit. D: Reflecting on the Impacts of Science. Some slides are below, but to see the full page, click here.
[IMaGE = International Mindedness and Global Engagment. To see my dissertation & resources on this, click here.]
“Levels of Why?” Graphic Organizer
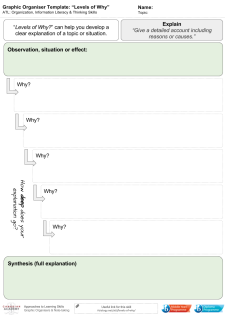
Levels of Why – click to download a pdf
This is a graphic organiser developed to help students move from outline or describe into explain.
- Begin with stating the situation, change or process.
- What is the surface explanation or reason?
- Why does that occur?
- What about that?
And so on…
Data Literacy with ‘Explore’ in GoogleSheets
Super-quick lesson idea for teaching datasets and presentation types. When processing data in Google Sheets, use the ‘Explore’ feature, highlighting parts of the dataset. Click here for an example (to save a copy, go to ‘file –> make a copy’).
For: Sciences, Maths
Thanks to Liz Durkin (@lizdk) for the reminder of this feature.
Questions to ask students
- What are different types of data (continuous, discontinuous)
- Why do we use graphical presentations of data?
- What information do we need to be able to present data clearly?
- Why are some data presentations suitable for some sets of data and not others?
- How are the ‘basic’ presentations of data limited? (or Why can’t I use a bar chart for everything?).
- How does my interpretation of the data change when I change the graph or chart type?
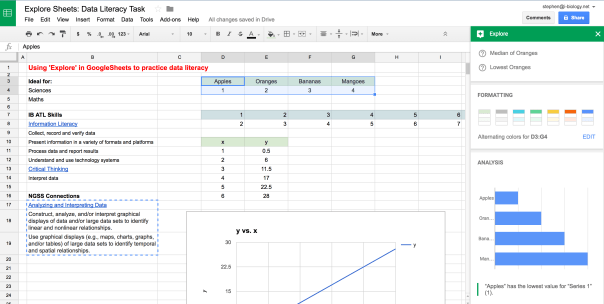 Explore in GoogleSheets – a quick way to visualize some of the data collected in an experiment or survey, and an opportunity to teach some data literacy and critical thinking skills. Click to open.
Going Further: Here is a set of resources for more advanced data presentation and statistics, used for IBBio, but useful for more: IBBio Statbook by Stephen Taylor. This one is for MYP Chemistry.
………o0O0o……….
MYP ATL Skills
| Information Literacy |
| Collect, record and verify data |
| Present information in a variety of formats and platforms |
| Process data and report results |
| Understand and use technology systems |
| Critical Thinking |
| Interpret data |
NGSS Connections
| Analyzing and Interpreting Data |
| Construct, analyze, and/or interpret graphical displays of data and/or large data sets to identify linear and nonlinear relationships. |
| Use graphical displays (e.g., maps, charts, graphs, and/or tables) of large data sets to identify temporal and spatial relationships. |
GoogleEarth Engine Timelapse: Quick Lesson Plan
Here’s a quick lesson plan idea for tuning into inquiry using Google Earth Engine Timelapse*. It can provide a timelapse of change from 1984-present, based on satellite and aerial photos.
Context
Ideal for: Individuals & Societies, Sciences, Interdisciplinary Unit
Global Context(s): Fairness & Development or Globalization & Sustainability
Key Concept(s): Change, Development, Interactions, Time-Place-Space
Related Concepts (I&S): Globalization, growth, resources, sustainability, causality
Related Concepts (Sciences): Environment, transformation, consequence, evidence
Tuning In
Find where we live and model See-Think-Wonder (Project Zero) on the timelapse from 1984-now. You might want to create a GoogleSheet with columns for each stage, to be shared with the class. Alternatively, get out some big whiteboards or butcher paper.
- See: look for general outlines, specific landmarks, big developments, interesting changes. Then dig deeper – compare the start to the end, or look for evidence of significant events in the time period. Keep pushing the ‘see’ until ideas are truly exhausted.
- Think: connected to the ‘see’ statements, note potential cause-effect relationships, sequences, consequences or other ideas. Keep going until this is exhausted.
- Wonder: finally build on the ‘see’ and ‘think’. What questions does this generate? Categorize and rank the questions.
Finding Out
- What lines of inquiry will you take to find out more?
- What can be found out by students and what needs to be explicitly taught?
- What unit-related vocabulary needs to be used and taught?
Approaches to Learning
- Access information to be informed and inform others
- Make connections between various sources of information
- Understand and use technology systems
- Practise observing carefully in order to recognize problems
- Interpret data
- Draw reasonable conclusions and generalizations
- Revise understanding based on new information and evidence
- Formulate factual, topical, conceptual and debatable questions
- Use models and simulations to explore complex systems and issues
- Identify trends and forecast possibilities
……….o0O0o……….
*HT Twitter:
Making the Invisible Visible: Climate Change & CO2
This is very neat video from NASA, showing carbon dioxide changes over time, with annotations. See a breakdown here.
Better Living Through Chemistry: Student Science Writers
In this compressed semester of Grade 9 MYP Chemistry, I had students do one full-length One World piece, written for a wider online audience. We had done formative One World work earlier in the semester, and the process of this article took a good few weeks, with drafting on GoogleDocs.
Brief: write a 1,200-1,500 word article for an online audience on the prompt “Better living through Chemistry: Chemical solutions to Global Issues.”
Assessment: One World and Communication in Science
Process: Topics proposed and drafted through GoogleDocs, with students seeking feedback on writing through highlighting and comments in the GoogleDocs. In the final sessions they put the articles together in WordPress and gave peer-feedback for quality of presentation, flow and message. We aimed to use images found through CreativeCommons Search and through Getty’s free Images(though the embed widget went squiffy on some of their wordpress editors).
Teacher note: this kind of task is a great way to realise that we are all language teachers. Managing workflow through GoogleDocs/Hapara makes commenting on drafts easier, though students need to keep their work there in order to show progression. The worflow and product are similar to the Grade 10 Environmental Science task, though with more scaffolding along the way.
……….o0O0o……….
Some highlights (with a range of scores) are posted below. Please click-through, read them and leave some encouraging comments!
- Access to clean water (and the Lifesaver Bottle) proved popular topics, with some great pieces by Jocelle, Joanne, Lisa, Kayla,
- Arushi explores the use of iodine tablets in the treatment of dirty water, and Omar looks at a nano-tech teabag.
- Lily-Rose outlines how oral rehydration therapy saves lives (and money), and so does Taimu.
- Plastic trash was also a popular issue. Fred writes about biodegradable plastics here, and Ryo describes the plastic to oil machine, as does Ben.
- Juhaku finds out more about hyperthermia as a way to potentially improve the effectiveness of chemotherapy
- Shina looks at how cancer diagnosis uses radioisotopes
- Kaiki describes biofuels as an alternative to gas or oil.
- Takeharu writes about an intriguing use of nano-scale crystals – to coat and protect vaccines for transport
- Masaki outlines the potential uses of carbon nanotubes
- Sheila describes how NSAIDS are used as anti-inflammatory painkillers
- Jonathan describes how sodium nitrite is used in food preservatives.
Exploring Environments: Science Writers
Building on last year’s Exploring Environments units (G10 Environmental Science), in which students formed groups and designed their own units of inquiry, we have once again taken on the science-writing challenge.
Brief: write a 1,200-1,500 word article for an online audience highlighting a case study connected to your unit’s central ideas. The articles should be aimed at peers and smarter, and should include properly-used media and video where appropriate.
Assessment: One World and Communication in Science
Process: Topics proposed and drafted through GoogleDocs, with students seeking feedback on writing through highlighting and comments in the GoogleDocs. In the final sessions they put the articles together in WordPress and gave peer-feedback for quality of presentation, flow and message. We aimed to use images found through CreativeCommons Search and through Getty’s free Images (though the embed widget went squiffy on some of their wordpress editors).
Teacher note: this kind of task is a great way to realise that we are all language teachers. Managing workflow through GoogleDocs/Hapara makes commenting on drafts easier, though students need to keep their work there in order to show progression.
……….o0O0o……….
Some highlights (with a range of scores) are posted below. Please click-through, read them and leave some encouraging comments!
- Bottom-trawling: destroying centuries of growth, by Polina
- Nozomi asks “Should we eat bugs?“
- “The ocean is turning to blue vinegar,” according to Jay
- Saumil explores George Monbiot’s articles on “how wolves change rivers” and how rewilding might help us return nature to some semblance of its former glory.
- Nyeong-Min asks us to “protect our UV protector“
- Seung-Cheol tells a bee story, exploring colony collapse disorder
- Luke coughs his way through the Beijing air pollution and places our demand for cheap goods at the root
- Lucas gives an explainer of PM2.5 pollution and thinks about what we can do about it.
- Andy gets concerned about the effect of CO2 on our beach time
- Koh asks if fish farming is a viable alternative to overfishing
Processing Data: A Department Student Learning Goal
In the 2012-13 school year, our science department worked on a collaborative Student Learning Goal to improve student performance in Criterion E: Data Processing. Click here to find out more about the process, outcomes and next steps.


